Data is slowly becoming one of the most valuable resources in today’s modern world. Data can give you intel on everything from who’s buying your product to what you should be selling. If you know how to gather and read it, data can tell you anything you need to know about the world around you. If you’re looking to tap into your data resources, you cannot forget about contextual data.
There are many ways in which contextual data can help you in your business as a processing plant. Whether you’re curious about the concept, or you’re looking to learn more about data, you’ve come to the right place. Here’s everything you need to know about contextual data and how to implement it. Follow this guide through these 6 methods, and introduce contextual data in your processing plant today!
What is contextual data?
Before jumping in and learning about the implementation of contextual data, it’s important to understand a few things first. If you’re wondering “What is contextual data?” you’ve come to the right place! You can think of contextual data as the backdrop or background, surrounding your main data points.
Contextual data, or context data, is a useful tool that can give you more insight into the data you’re collecting and how to use it fully. Now that you’re more up-to-date on the basics, it’s time to learn how to implement this valuable data tool. Follow this 6-step guide to implement contextual data into your plant!
1. Enhance how you gather data
When it comes to introducing contextual data into your processing plant, you first need to gather it. You can’t use data if you’re not gathering and collecting it! Gathering data can be tricky work, so it’s important to find the best way to do it to achieve the best results. There are plenty of ways to enhance how you gather your data. Your data collection methods can make or break your business so they need to be efficient and fully integrated. You also need to be able to insert protocols for storing, organizing, and reading your data the right way.
2. Organize and sort your data
Storing your data is almost as important as gathering it. Contextual data can be stored in a variety of ways, but not all are equally good. Before you can implement your data analysis programs, you need to round up your data and tidy it up! You’ll need to start by making sure all your data is formatted and saved in the same way. This makes reading it easier and can streamline your processes. To make the most sense out of your data, you’re going to need to store it in a way that makes reading it easy. Take the necessary steps to prep your data before analyzing it to save time and money.
3. Ensure access to data
Once your data is gathered and organized, you need to make sure it’s safe and secure. As a processing plant or any business for that matter, your data is your most valuable asset. You need to keep it safe from prying eyes while making sure you still have access to it. You need to ensure access to your data so you and your analytic software can use it when needed. Make sure to remove any silos and barriers between data sources, and to make sure it’s all stored in the same format. This will make reading your data easier and will make using your data a much simpler process.
4. Create meaningful connections
Once you’ve gotten your data sorted, it’s time to make sense of it. When it comes to data, all the data in the world won’t do you much good if you can’t make sense of it. You will need to notice and identify patterns that can help you make sense of what you’re looking at. The key to understanding and using data is learning how to read it. To make sense of your data, you’ll need to learn how to create and identify meaningful connections between them. To do this, you’ll need to first identify your domain experts. Subject-matter experts, or domain experts, help organize and decipher contextual data to speed things up.
5. Visualize your data

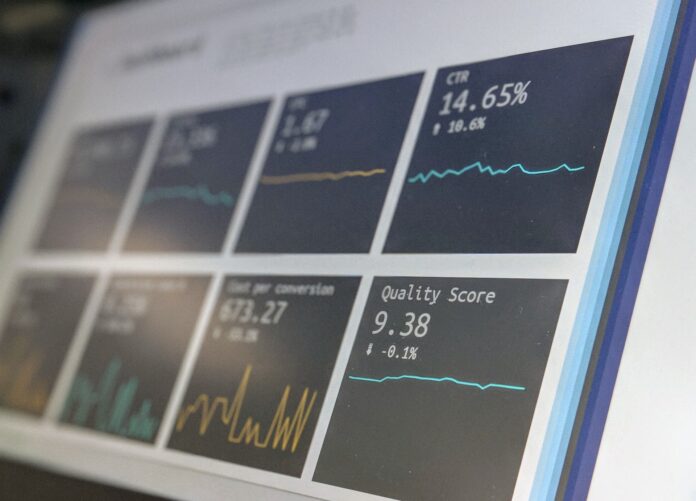
In most cases, whatever the data type may be, you can’t make sense of it until you visualize it. Data, in its simplest form, is a bunch of numbers and patterns, which until you visualize, won’t yield much useful information. There are many ways to visualize contextual data from graphs, charts, or complex images. To find the best way to visualize your data, you need to find methods that are user-friendly, intuitive, and easy to use. Look for ways to visualize and display your data so that any one of your stakeholders can understand it. Proper visualization is the key to making use of contextual data.
6. Put what you’ve learned into practice
Last but not least, the final step in implementing contextual data in your processing plant is to put into practice what you’ve learned. Whether you’ve identified key data points or practices, or you’ve identified new areas to research, you need to act on them. Take what you’ve learned from your data and start making changes to your plant. Making big changes can be tough, so it’s important to go one by one and take things slowly. When you start applying what you’ve learned, remember to continue researching and collecting more data. This will ensure that you continue to optimize your plant in the future.
So there you have it! With this guide in mind, you’re ready to add contextual data to your process plant like a pro! When implementing contextual data, you first need to do your research and understand it. Once you’ve done your homework, you can start working on gathering it in the right way. You need to sort and organize your data so that it is safe and secure while easy to access.
You need to find ways to identify patterns and create meaningful connections with your data. Find ways to visualize your contextual data so that anyone, who needs to, can understand it. Finally, apply what you’ve learned from your data to your plant to improve your business. Keep these tips and tricks in mind and remember to make the most of the valuable asset that is data!


