


In an era where information overload is the norm, businesses are increasingly turning to data-driven insights to make informed decisions. The ability to gather, process, and interpret data efficiently has become a cornerstone for success in today’s fast-paced and competitive landscape. At the heart of this data revolution lies the importance of dashboard design and visualization. Dashboards serve as the visual interface that transforms raw data into comprehensible insights, empowering decision-makers to navigate the complexities of their operations with ease. In this article, we explore the significance and multifaceted benefits of effective dashboard design and visualization in the business world.
Measure the Metrics that Matter
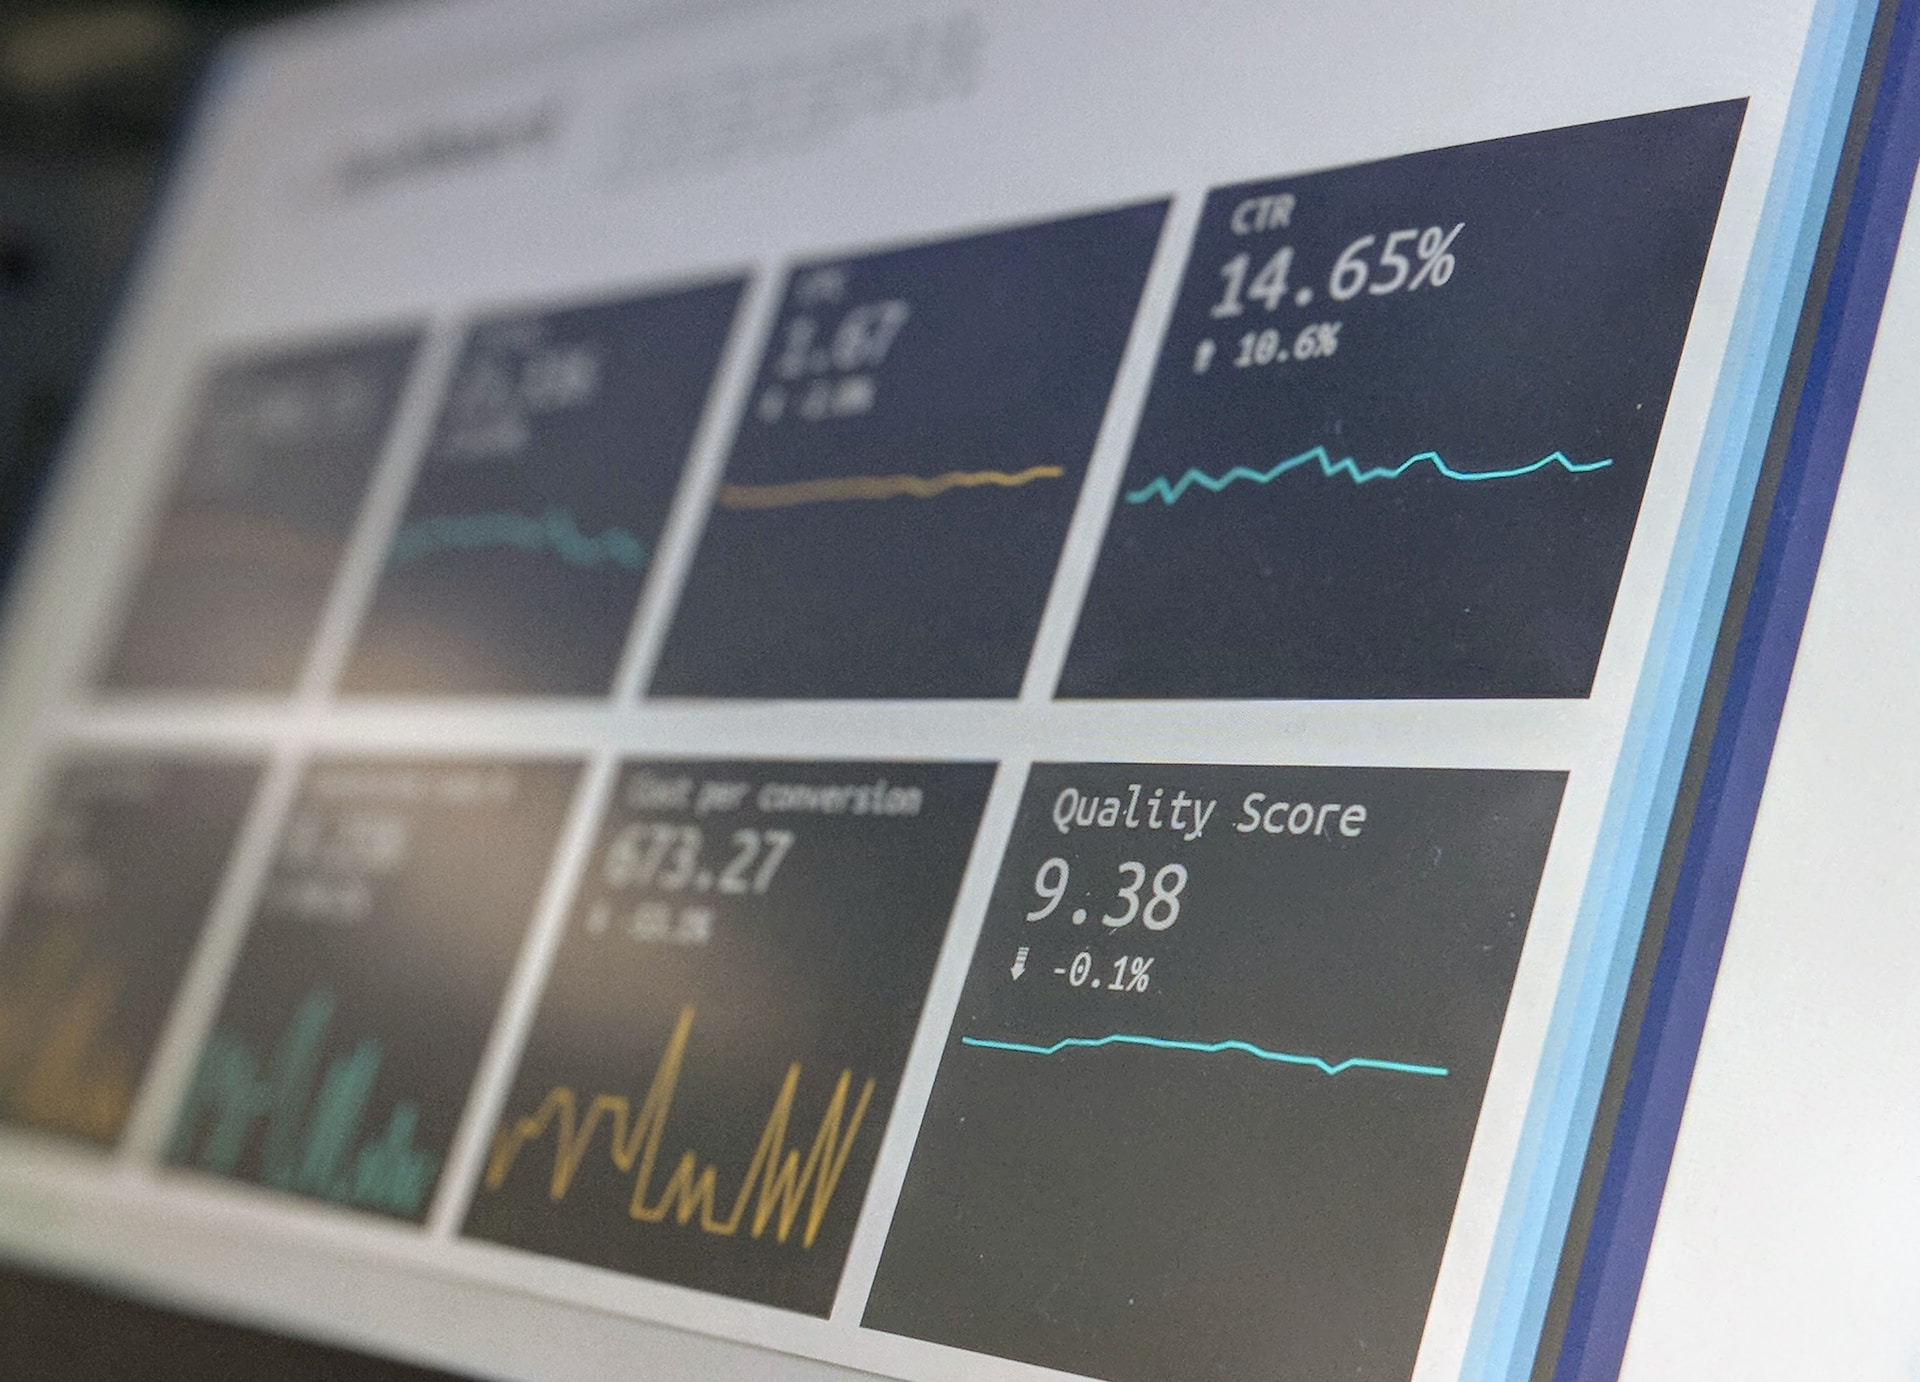
By presenting key performance indicators (KPIs) in a visually compelling manner, dashboards allow stakeholders to quickly grasp the health and trajectory of various aspects of their business. For instance, a sales dashboard might display real-time sales figures, conversion rates, and customer acquisition costs, enabling sales teams to identify trends, spot opportunities, and address challenges promptly.
Effective dashboard design goes beyond just displaying data; it prioritizes relevance. A cluttered and convoluted dashboard can hinder decision-making rather than facilitate it. Therefore, dashboards must be tailored to the specific needs of the audience, as seen at KeyData, presenting a concise and clear snapshot of the information that is vital for decision-making. The strategic alignment of data presentation with organizational goals ensures that decision-makers can focus on the metrics that are truly indicative of success, leading to more informed and effective choices.
Visual Storytelling for Actionable Insights
Humans are inherently visual beings and the power of visual communication cannot be overstated. Dashboards leverage this inherent trait to turn complex data sets into coherent narratives, making it easier for users to identify patterns, correlations, and outliers. Through intuitive charts, graphs, and other visual elements, dashboards create a narrative that transcends numbers, providing a holistic view of the data.
Visual storytelling is not just about aesthetics; it’s about fostering a deeper understanding of the data. When decision-makers can easily comprehend the story the data tells, they are better equipped to derive actionable insights. Whether it’s identifying areas for improvement, recognizing emerging trends, or assessing the impact of strategic decisions, the visual narrative presented by dashboards accelerates the decision-making process.
Enhancing Collaboration and Transparency
Dashboards serve as a common ground for teams and departments, offering a shared platform where everyone can access and interpret the same set of data. This not only fosters a culture of transparency but also streamlines communication across the organization.
Furthermore, dashboards enable real-time collaboration, breaking down silos and facilitating cross-functional insights. When different teams can access and understand the same data, they can work cohesively towards common goals. This collaborative approach not only enhances efficiency but also ensures that decisions are well-informed and aligned with the broader organizational strategy.
Driving Continuous Improvement
By providing a dynamic and real-time view of performance metrics, dashboards empower organizations to adapt swiftly to changing circumstances. Whether it’s adjusting marketing strategies based on customer feedback or optimizing production processes in response to supply chain disruptions, dashboards facilitate agile decision-making.
Moreover, dashboards enable organizations to track the impact of changes and initiatives over time. By monitoring key metrics before and after implementation, businesses can assess the efficacy of their strategies and make data-driven adjustments for ongoing improvement. This iterative process of analysis and adaptation is crucial for staying competitive in an ever-evolving business landscape.
The importance and benefits of dashboard design and visualization extend far beyond the realm of data presentation. Dashboards serve as powerful tools for measuring meaningful metrics, telling visual stories that drive actionable insights, fostering collaboration and transparency, and fueling a culture of continuous improvement. As organizations continue to navigate the complexities of the modern business landscape, the role of effective dashboard design becomes increasingly pivotal in ensuring that decision-makers have the clarity and understanding needed to steer their organizations toward success.

 – Create Stunning Videos with AI")
